
TP RSI Indicator
TP RSI v2.0 is built on the three-dimensional integration principle in technical analysis: Trend, Momentum, and Volatility. Instead of switching between multiple indicators, TP RSI brings everything onto a single screen.
TP RSI v2.0 is built on the three-dimensional integration principle in technical analysis: Trend, Momentum, and Volatility. Instead of switching between multiple indicators, TP RSI brings everything onto a single screen.

LHF (Lorentzian Harmonic Flow) posits that market time doesn’t tick evenly like a clock. When volatility spikes, time is “compressed” — a week’s worth of action can unfold in minutes. When the market ranges, time “expands” — price oscillates with no clear trend.
LHF applies the Lorentz formula from Einstein’s relativity to compute the gamma (γ) factor — representing the degree of time compression/expansion:
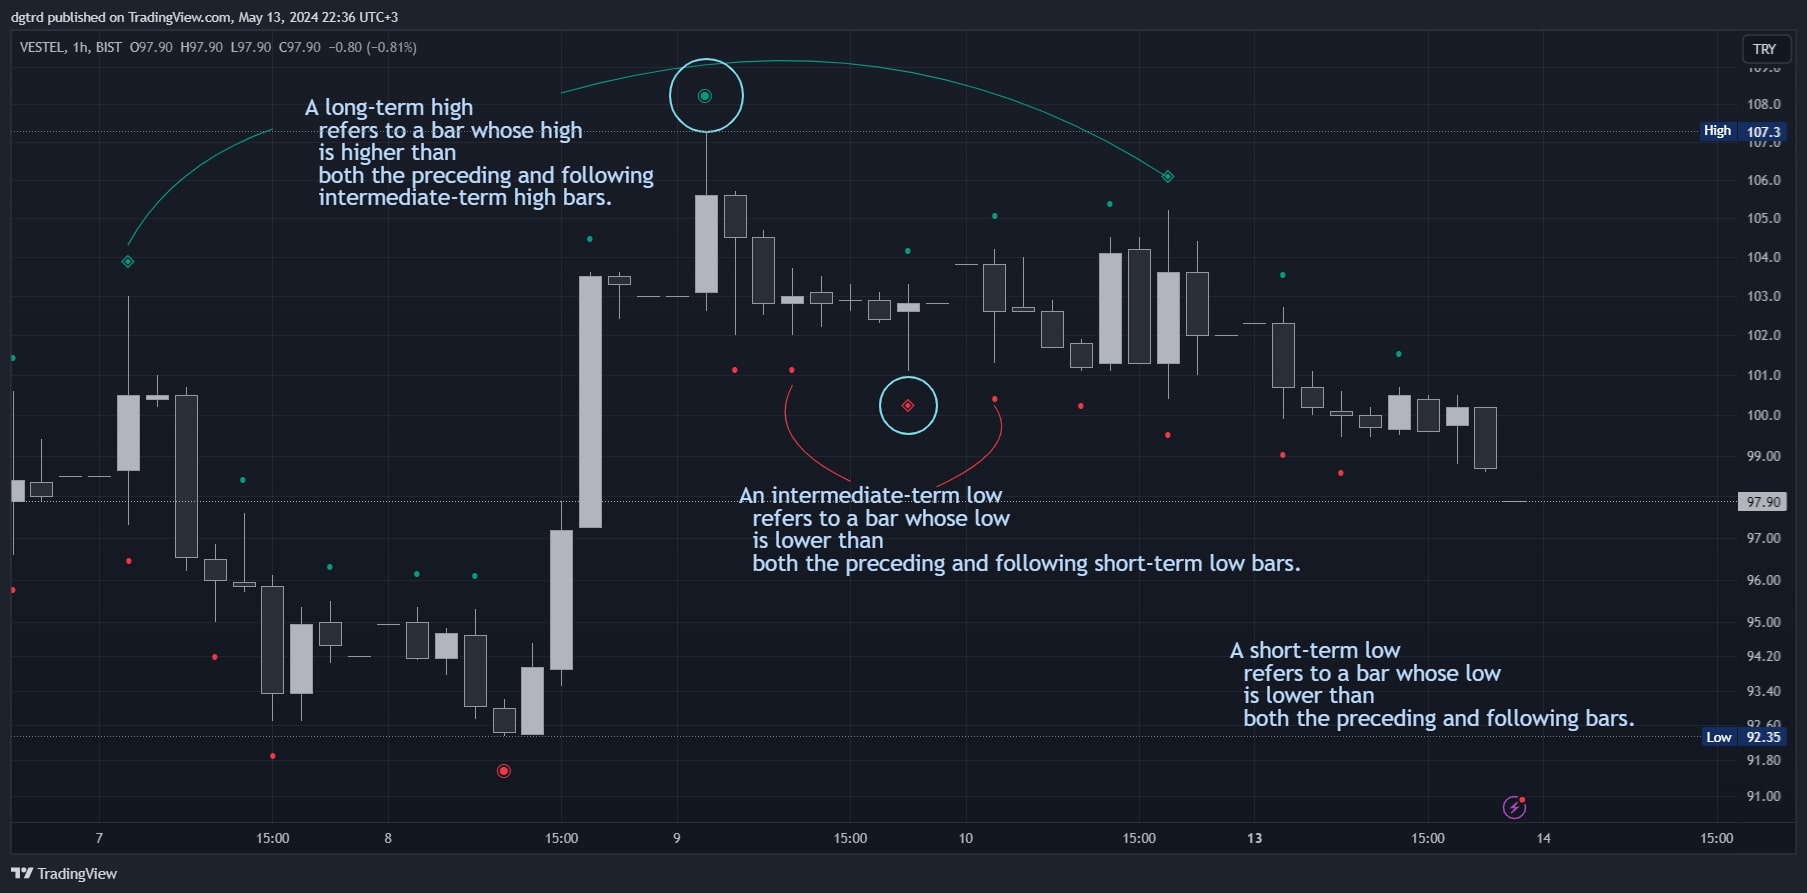
This indicator is built on the Market Structure theory of ICT — a well-known price analysis approach in the trading community. The core idea is: price does not move randomly; it follows rule-based structures.
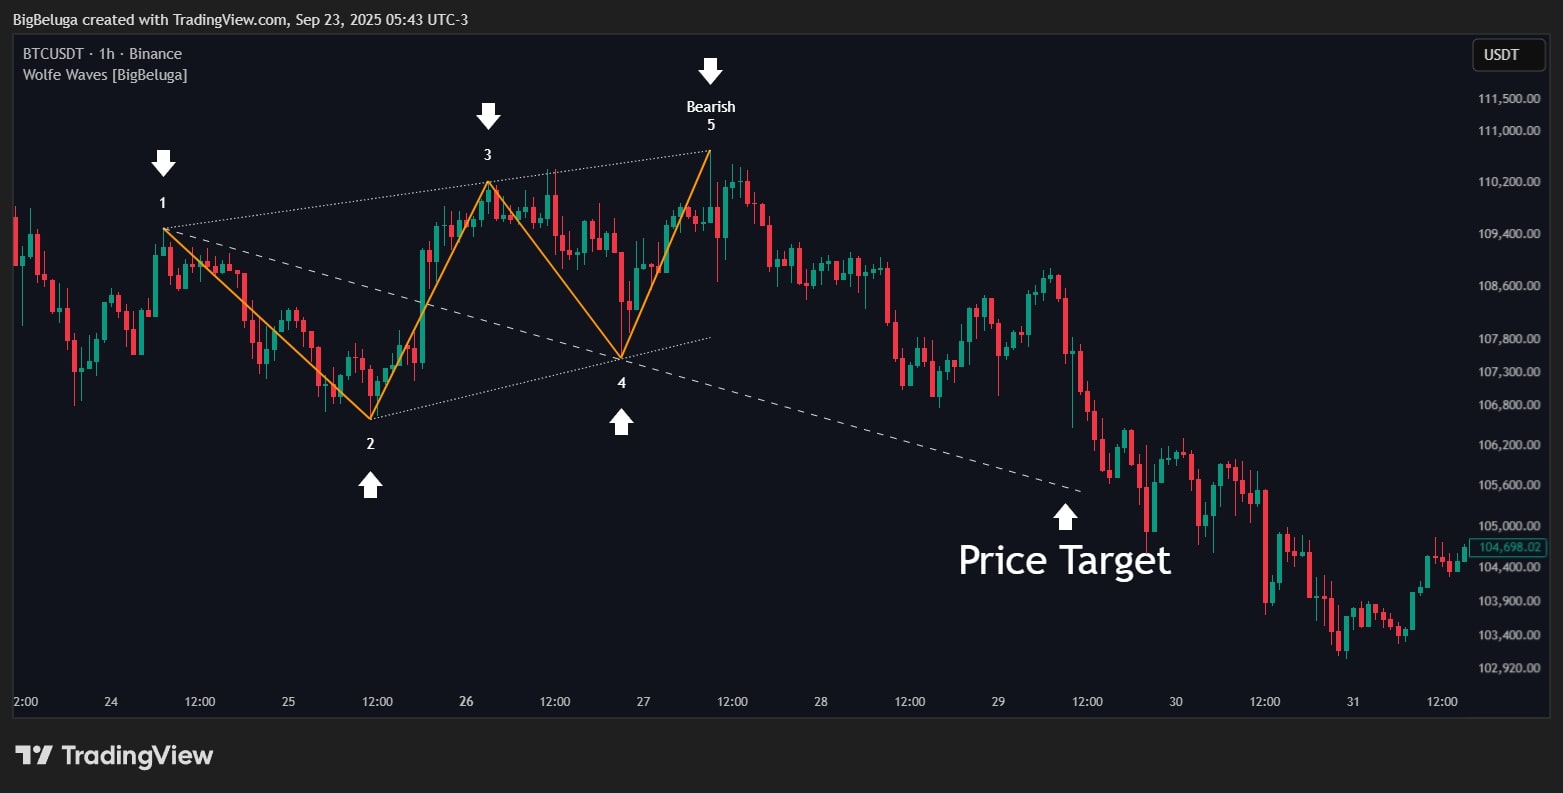
The Wolfe Waves indicator is based on the theory developed by Bill Wolfe during the 1980s–1990s. He was a trader who specialized in studying market geometry and the natural rhythm cycles of price movements.
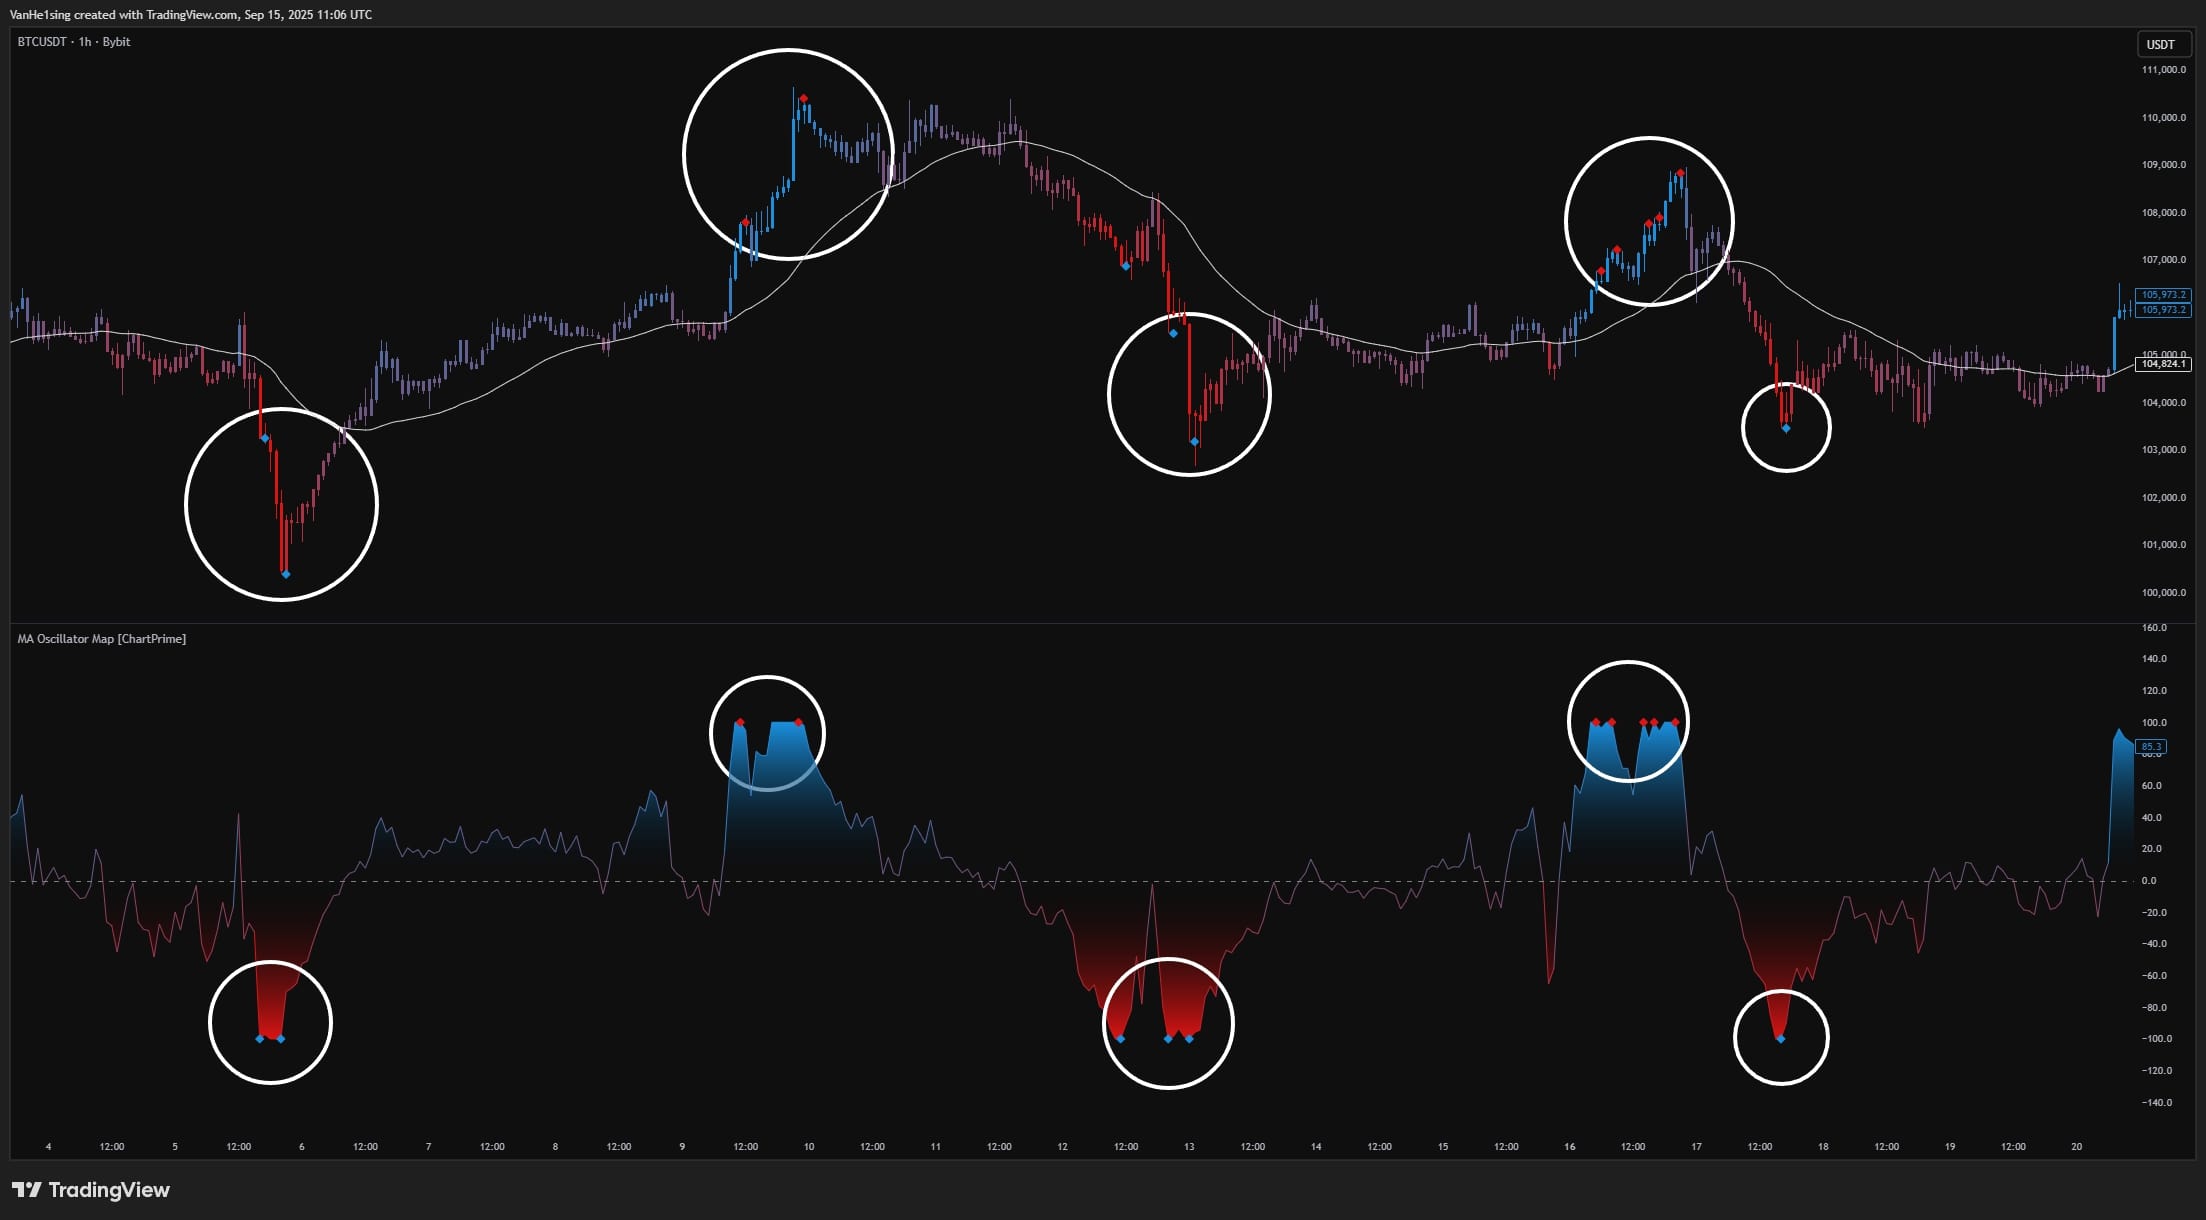
Core idea: take the deviation between price and a moving average (MA), normalize it to a ±100 scale so that overbought/oversold conditions are consistent across symbols and timeframes. When the oscillator (osc) “cools off” from the extreme +100 or −100, the indicator flags potential exhaustion and reversal. From these extremes, it also extends short-term reference levels (dotted lines) acting as temporary barriers until price breaks them.

Trade War 2018 vs Trade War 2025 Comparison ⚔️ I. DETAILED COMPARISON TABLE TRADE WAR 2018 vs TRADE WAR 2025 📅 1. START DATE 🔵

In the world of logic and reason, humans have long believed that as long as we follow the right process, every problem can be solved.Take

This will be my answer to the questions people often ask:“So, has Code2Trade actually made any profit?”or “If it’s really that good, why not share

I criticized TradingView for four major limitations — and even Alex David, the director of NinjaTrader, agrees with me: If you don’t understand these four

Hundreds of fancy trading methods.Thousands of indicators full of promises.But how do you know which ones are real and which are just hype —which actually